Setting up Xdebug with PHPStorm and Docker
Here's a straight-to-the-meat tutorial on how to use XDebug with PHPStorm when your code lives in a Docker container. This is for Xdebug version 3.
Configure XDebug in your PHP container
You docker container running PHP (phpfpm most likely) must be configured to use Docker.
To do so, makes sure that PHP loads the XDebug config file. E.g. for a Debian container and php-fpm 8.0, you must have the file /etc/php/8.0/fpm/conf.d/20-xdebug.ini. In this file, put the following config:
zend_extension=xdebug.so

xdebug.mode=debug
# default for linux, for mac use "host.docker.internal"
xdebug.client_host=172.17.0.1
xdebug.client_port=9003
# Uncomment the line below to have XDebug trigger systematically (on each request or CLI script)
# xdebug.start_with_request=yes
Explanation of the parameters:
xdebug.mode: thedebugvalue lets you do step debugging.xdebug.client_host: the IP of the client with which you'll debug (PHPStorm). On mac, usehost.docker.internal. On Linux, use the host IP, which often is172.17.0.1(but you can usedocker network inspect <network_name>to be sure)xdebug.client_port: optional, by default it's9003but if you have a different configuration you can specify the port here.
Then there's the xdebug.start_with_request. If you specify it to yes, then XDebug will alwyas trigger PHPStorm, whether you launched a web request or a PHP script. If you use this parameter, you'll have to enable the Run > Start listening for PHP debug connections in PHPStorm, but you won't be able to use a specific Debug configuration, which I don't really like.
Configure PHPStorm
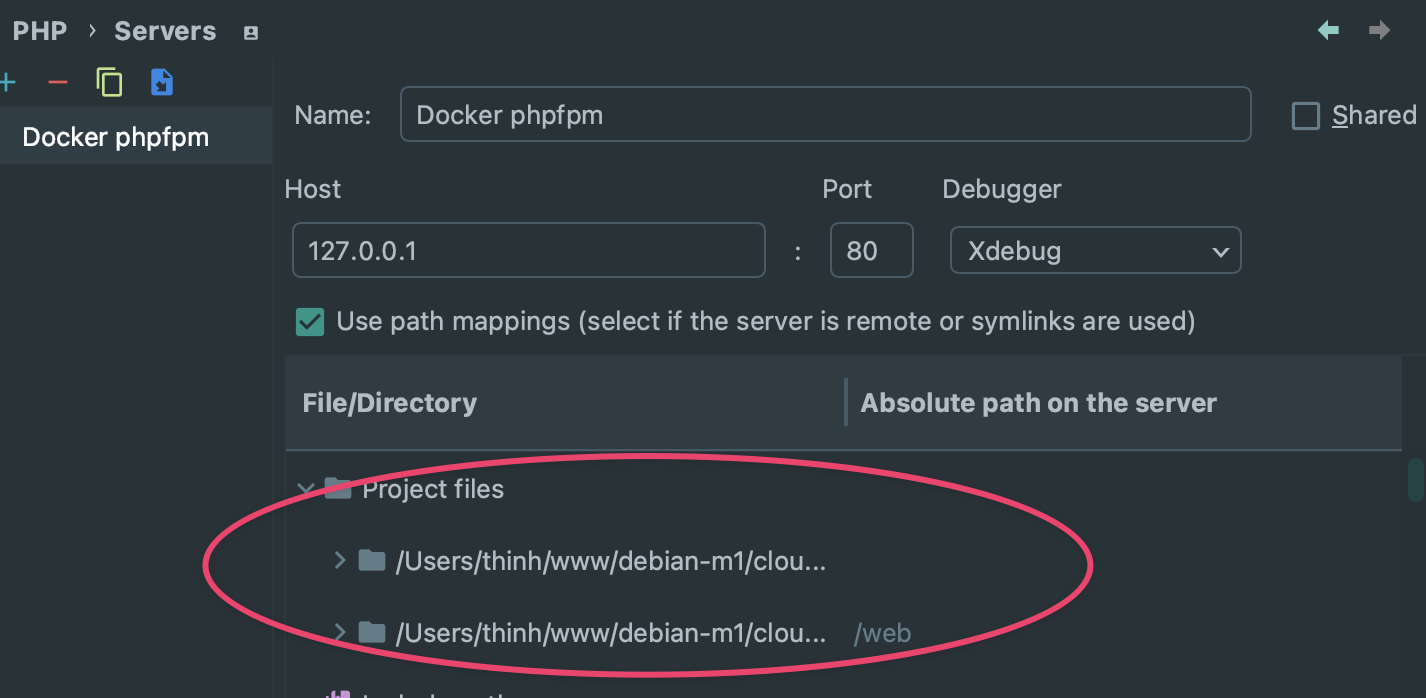
Next, head into PHPStorm preferences, and go to PHP > Servers. Create a server and configure it like this:
Name: whatever you wantHost: 127.0.0.1Port: 80Debugger: XdebugUse path mappings: check the box. Since your files reside in a Docker container, you have to indicate to PHPStorm how to find your files- Then setup your path mappings, mapping your local files to the path they exist in inside your Docker container.
The last step of configuration is under Run > Edit configuration.
Create a PHP remote debug configuration:
Name: name it whatever you want (butXdebugsounds fine),- Check
Filter debug connection using IDE key Server: select the server your created in the previous stepIDE key (session id): use whatever you want but remember this value as you'll use it later to trigger the step debugging.
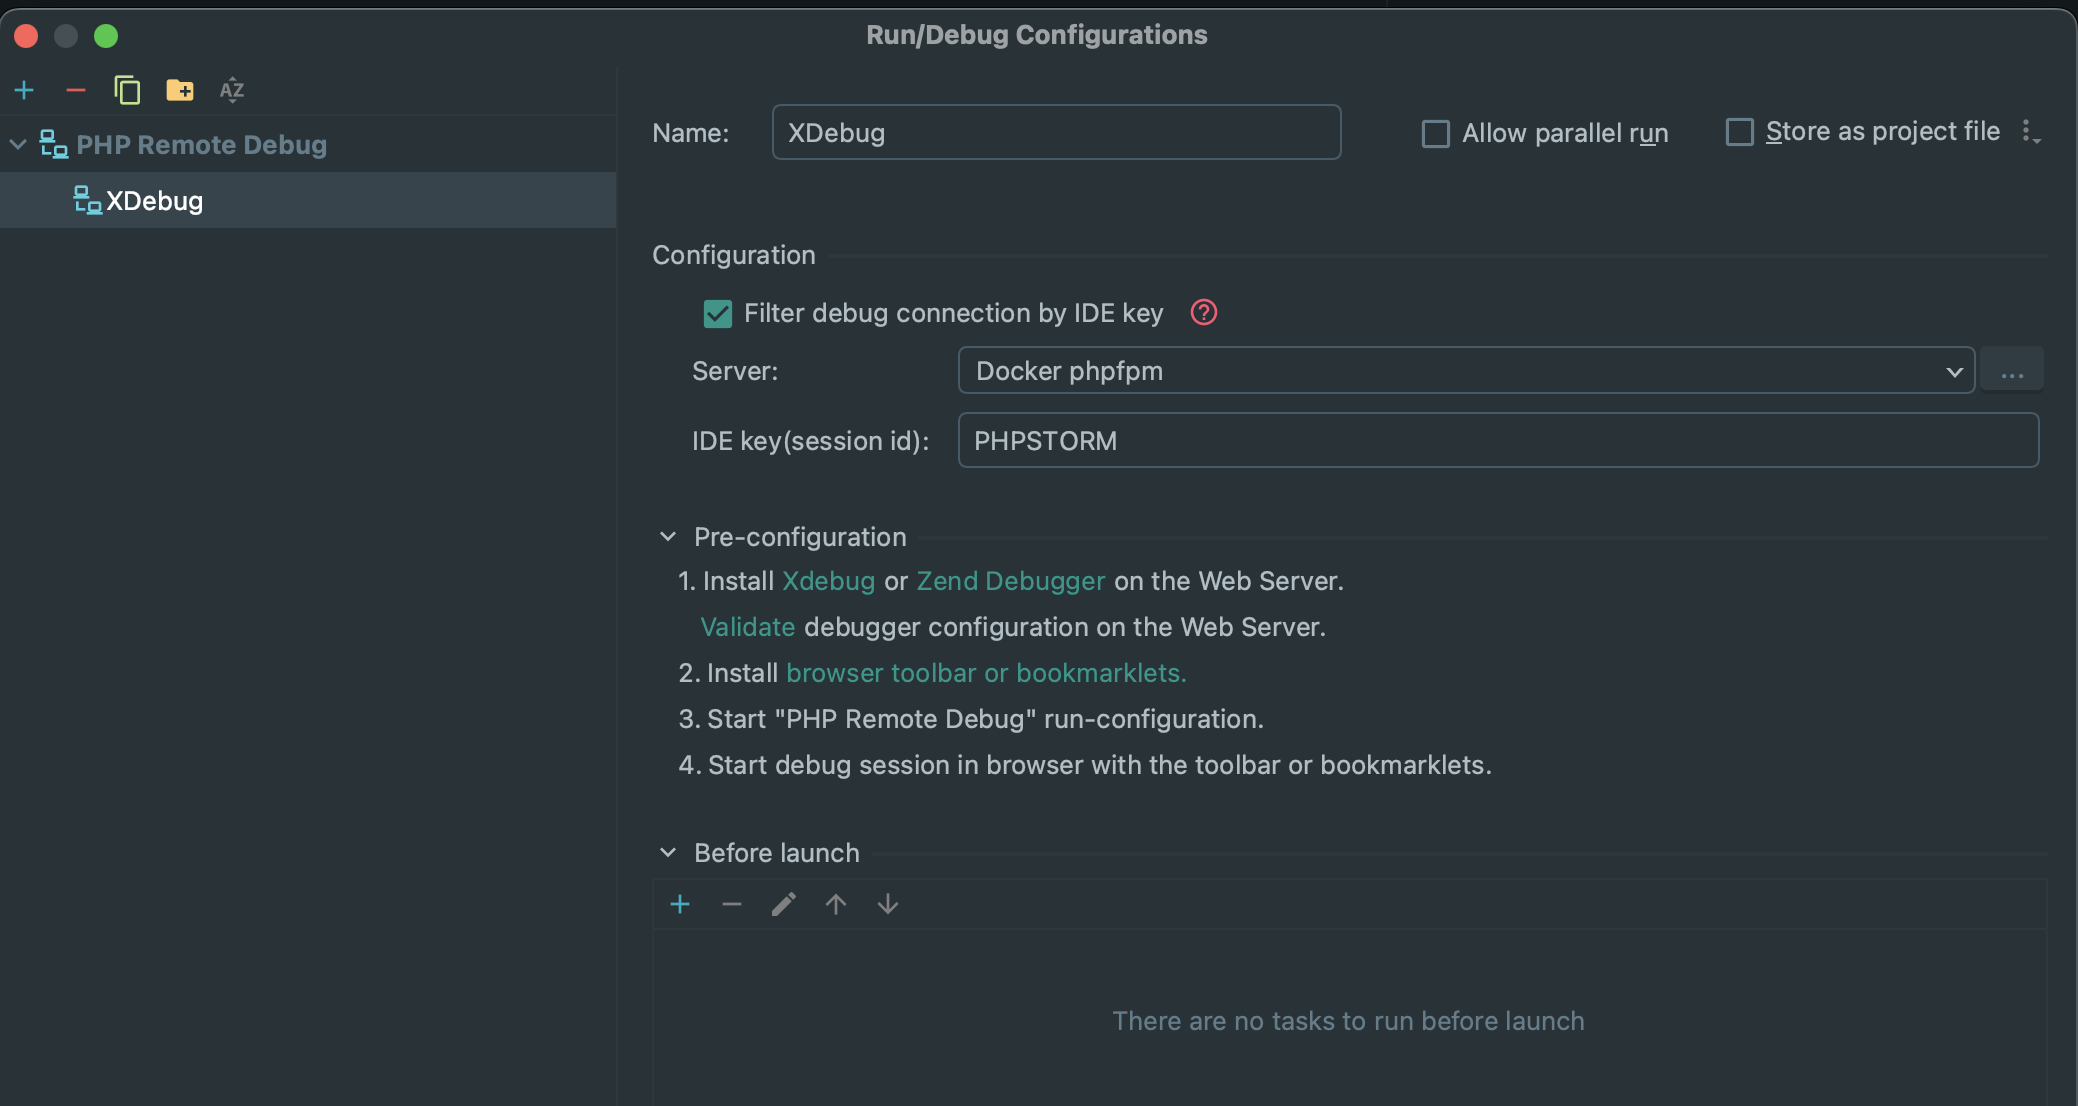
Click OK to save the settings.
Triggering a debug session
Now the configuration is done, all you have to do to start debuggin is to first add a breakpoint in your code. Next, you have several options (all explained on Xdebug official documentation):
- When launching a web request
- You can download a browser extension that will let you enable debugging on the fly
- Initiate the session by adding a
GETorPOSTparameterXDEBUG_SESSION=session_name(this is where you specify theIDE keyyou specified in PHP Storm debug configuration. For simplicity I usedPHPSTORM). So if you add?XDEBUG_SESSION=PHPSTORMat the end of your URL, it should trigger the debug session. - If you want to trigger Xdebug for multiple requests without having to add a parameter to the request each time, use the parameter
XDEBUG_SESSION_START=PHPSTORMjust once. It will set a cookie and trigger the debug session for all subsequent requests. To remove the cookie, useXDEBUG_SESSION_STOP=PHPSTORM.
- When using a CLI script
- Xdebug looks for the
XDEBUG_SESSIONenvironment variable. So just use:
export XDEBUG_SESSION=PHPSTORM
and you'll be good to go.
- Xdebug looks for the